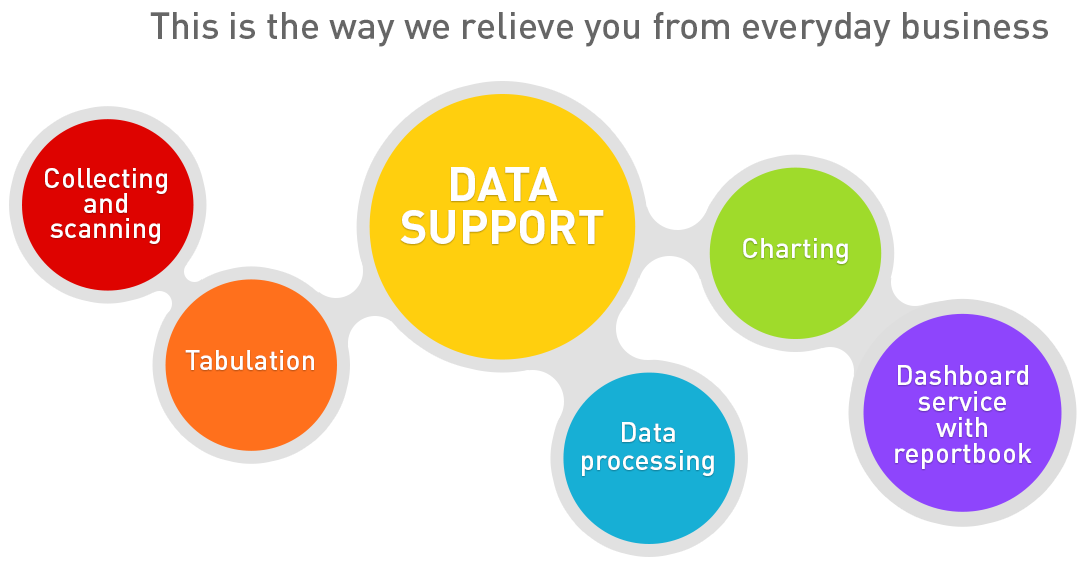
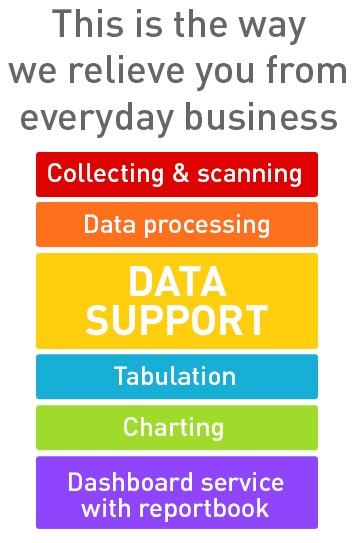
Collecting and Evaluation Services

Data Import and Export
If your data is already available in electronic form, we can import it from any format for further processing. This includes standard formats such as ASCII, Excel, Triple-S, Colbin, SPSS, Quantum, CNT and many others. For special formats, we program the import individually.
Naturally we can also export your data in any required format. This is a service that not everyone can offer; especially because we can implement these complex import and export steps for a project in parallel for all required formats.
Quality Assurance for your Data
Data Check
The quality of a project’s results is determined by the quality of the data. To guaranteeing this, a whole series of measures are required in the course of a study. Therefore we have built in a tightly-meshed network of measures to ensure the quality of your data.
Check for manual data entry
For both manual data and optical data entry (scanning) we use a tool that was programmed in-house and is able to pre-define permitted values. Data entry is carried out by carefully trained staff. The quality of your data is assured by constant and targeted monitoring of the data entry process.
For interviews conducted with our interview software CIS there are many options for content checking, so that inconsistencies can be clarified even during the interview.

Check in tabulation software
When raw data is imported, it is analyzed by our powerful tabulation software. This performs complex checks and – where necessary – cleans the data, both case by case and globally for all interviews that meet specified testing conditions. This cleaning procedure can be reversed or modified at any time. Our tabulation software is script-based, which offers advantages not only in terms of great flexibility in tabulation and data export, but also for quality assurance. As well as the normal proofreading of the script, the data or tables are also checked against the raw data.
Scanning Paper Questionnaires
We can read completed questionnaires using powerful scanning devices. We developed the necessary software in house. Not all questionnaires are suitable for scanning. We are happy to advise and support you in the development and production of questionnaires suitable for reading by a scanner.
Dashboard service with reportbook
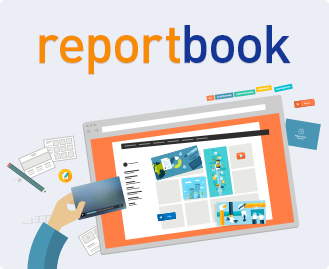
Dashboards: the dynamic presentation of your data
Our service supports you in the visualization of your data in our dashboard tool reportbook. We accompany you in every phase of your project in which you would like to benefit from our expertise – from support in the transfer of data to the complete creation of your dashboards. Everything always in close coordination with you. Talk to us about your project: Sönke Uhde, 040 25 17 13 37 or suhde@ifad.de.
Our service:
- Import your data into reportbook, (almost) all formats are possible
- Preparation of your data in reportbook – as a dashboard or as tables
- Maintenance of the reports
- Organization of access rights
Your advantages:
- Full concentration on your data, analyzes and results
- Perfect look thanks to our experience with reportbook
- Dynamic time series analysis for brand tracking
- Dashboards in your corporate design
- Dynamic crosstabs with graphical significance test
- Video and image integration
- Comprehensive rights management for any number of groups, participants and reports
Management of Postal Surveys
Project Management
If postal surveys are not part of your everyday business, or you just don’t want to concern yourself with all the details, IfaD can offer worry-free, all-in-one project management. Naturally you can also pick and choose individual components of this service.
Project Handover and Preparation
You deliver us the questionnaire(s) together with a standard letter of invitation as MS Word documents, and the addresses in an Excel file. We prepare the various elements and allocate respondent numbers to each questionnaire.
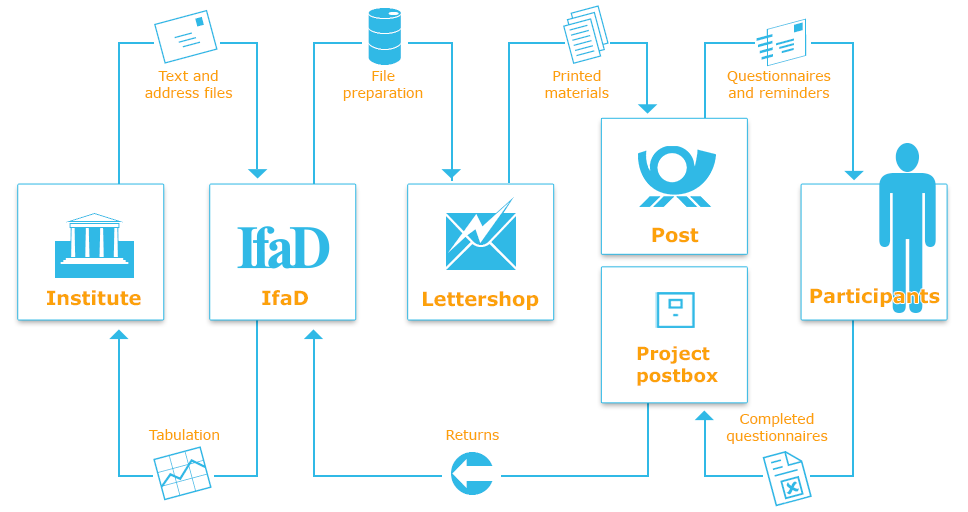
Schematic process of a postal survey, simplified
Lettershop Handling with Partners
For printing and mailing, we cooperate with a reliable and experienced lettershop, which handles the printing of questionnaires, invitations, reminders and envelopes, stuffing, optimization of postage costs, and delivery to the mail service.
Handling Returns and Reminders
Returns are sent to a special postbox created for each project. Our Data Support team controls the incoming questionnaires by reference to the respondent numbers and check codes. The lettershop undertakes the sending of reminders.
Data Entry, Scanning, Coding, Tabulation
We punch and scan the incoming questionnaires, and code the open questions, throughout the whole fieldwork period. After the close of fieldwork, you receive a table set with the full tabulation of all closed and open responses.
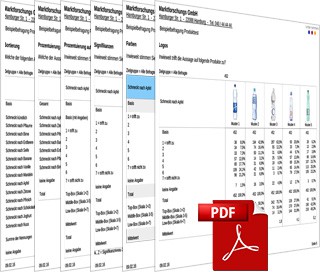
Tabulation
Tabulation
For analysis and the resulting report, every market researcher needs clear, legible and well-organized tabulation of the survey results. But the starting point is always nothing but pure numbers and symbols in a wide variety of data formats. We convert these into tables for you in line with your specifications, and deliver them to you as a PDF and/or Excel file.
All Formats
The tabulation software CNT can handle (almost) all kinds of data (ASCII, Excel, SPSS, Quantum, Colbin and many others) without problems. Tables can also be generated from a mix of different data formats at the same time. Thus, for example, we can easily integrate data from previous surveys into your current project.
Individual Layout
We are happy to adapt table layouts to meet your requirements, even when these deviate from our normal standards. A range of freely selectable font sizes, logos (also in the column headers) and color-marking of specific values or lines/columns are all possible.
Statistics
Commonly-required statistical information, e.g. average, standard deviation and standard error, is included. We are also happy to calculate other key data such as medians, modes, percentiles, minima and maxima, and integrate these into your tables. Percentages can be either line or column-based, and tables can also include index values and rankings. With independent or dependent t-tests, the error probabilities for multiple, freely-selected levels can either be presented with column tags in alphabetical form or with the exact value in the tables.
Weighting and Checking Data
If required we can also weight your data. Complex, multi-stage weighting specifications can be handled. Needless to say, we carry out data and base checks as standard. In consultation with you, we can either clean erroneous data with our software or exclude it from the tabulation.
Tool for In-House Tabulation
We can also provide you with a tabulation tool that allows you to make your own in-house tabulations. You can define your own tables, new variables, headers and filters. You can produce the tables online on our tabulation server or offline on your own computer or in your own network.
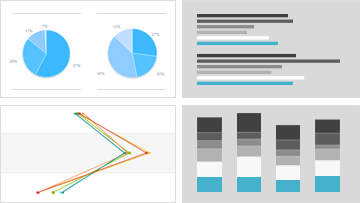
Charts in customer CD
Data Volumes in Your Template
For projects with large numbers of subgroups, (e.g. employee surveys in numerous branches or outlets), we can create chart sets using your templates.
You provide us with a master containing all the chart details. We populate your templates with data from the survey and automatically generate a separate volume in Excel or PowerPoint for each subgroup – quickly, accurately and at low cost.
Your Graphics Requirements in our Charts
All the data that we process for you can also be provided in chart form. We use a standard solution for this purpose. Let us know your special charting requirements, e.g. if you wish to integrate a company logo or other graphical elements, or any other information. We can do (almost) anything.
Data Fusion
“The questionnaire is too long”
Sounds familiar? The themes and topics to be investigated are so extensive that your questionnaire is too long. The natural result is more break-offs and reduced quality of responses. But you don’t want to – or cannot – dispense with any of the information. The only realistic possibility for reducing the side-effects of an excessively long survey is to split it into two sections. But ultimately you will require one, coherent data set. We have the expertise and the appropriate algorithms to assist you in this tricky task.
Data fusion as a possible solution
Depending on the nature of the questions, the solution may be to combine the surveys by means of data fusion. Each case in the first survey (recipient) is allocated to a “statistical twin” (the nearest neighbor, i.e. the case with the greatest similarity in key questions) in the second survey (donor) and a complete data set is thus created.
We can assist you
If you have any questions about data fusion, or the possibilities and limits of this interesting procedure, our experts will be happy to consult with you.
Databases
“Taking the long view of your data”: Individual survey components
Often, questionnaires or individual questions recur in the same or comparable form in different surveys, whether it is for tracking studies where the same questions are repeated at intervals, or similar surveys at different events, or a regular event where the same survey is repeated. It is often desirable to have comparative tables from these individual surveys.
Merging of Data
We can merge the data from your individual surveys into a database, i.e. we create an overall data file suitable for tabulation, containing all the identical or comparable questions. We then put these into a common format.
Tabulation
This provides the basis for easily producing comparative tabulations and time-series analyses. We produce the required tables for you, or we make the data available to you in a tabulation tool. This tool can be customized to your project and your requirements (e.g. selection options, pre-set table layouts, dialog windows for table design). With the aid of this tool you can easily generate the required tables for yourself at the press of a button (online or offline) whenever you wish.