Practical example: Regression Analysis
A spirits manufacturer intended to plan the optimal positioning of one of his products – an herb liqueur – within the competitive environment. With this in mind, a tracking study was put in place to monitor specific changes in the product over a long period. In a qualitative phase, 16 items were defined which were combined by means of a factor analysis into three major mutually-independent fundamental dimensions:
- Taste/effect
- Tolerability
- Disturbance
For the reduction to these three dimensions see „Identifying fundamental dimensions“.
To determine the effectiveness of product changes, the analysis needs to show what influence these dimensions have on willingness to buy an herb liqueur.
Objective
Analysis
To answer the above-mentioned question, a regression analysis was carried out.
The liqueurs tested were rated both on specific aspects and on overall willingness to buy (using a 7-point Likert scale). The use of independent fundamental dimensions avoided the serious problem of multicolinearity. It also delivered very fundamental statements regarding the drivers of willingness to buy. To obtain more detailed indications of possible influences, the original individual items could be used. But because such individual ratings generally inter-correlate, appropriate steps had to be taken to avoid misinterpretations due to distorted coefficients. These steps are described in the chapter „Causal analysis with RALV“.
The regression analysis produced the following results:
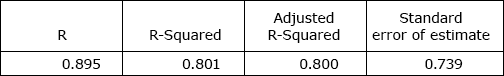
Fig. 1: Coefficient of determination
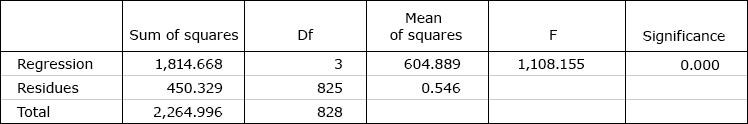
Fig. 2: Analysis of variance
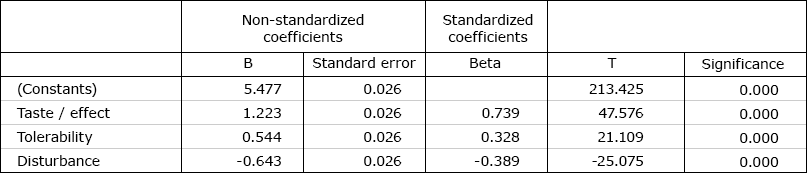
Fig. 3: Coefficients
The coefficient of determination (R-Squared) in Fig. 1 indicated that ca. 80% of the total variance of the dependent variable “willingness to buy” is explained by the three fundamental rating dimensions. This is a very high proportion.
The analysis of variance in Fig. 2 shows that the share of variance explained by the model has a high level of significance. It can be assumed, with an extremely low probability of error (under 0.05%), that these factors influence willingness to buy.
Fig. 3 shows the regression coefficients. The error probabilities in the column headed “Significance” indicate that all the factors are very likely to have an influence on willingness to buy among the target group used in the study. This means that the content of the coefficients is interpretable. The beta coefficients are used in order to compare the strength of the influence of the various factors.
It can be seen that the influence of “taste / effect” on willingness to buy is greater than the influence of “tolerability” and “disturbance” together. The minus sign shows that the factor “disturbance” reduces willingness to buy.
Since all the factors have a very high and statistically proven influence, clear recommendations for action are not possible without further information. It appears that aspects contained in the “taste / effect” factor are most relevant for boosting willingness to buy.
However it must also be considered how far a product differentiation in specific areas is technically feasible or economically viable. It is also important to know how the client’s product is positioned in comparison to its competitors, in order to be able to identify decisive product weaknesses or opportunities offered by available niches. For this see “Market positioning”.