Practical example: Factor Analysis
Objective
A spirits manufacturer wished to plan the optimal positioning of one of his products – an herb liqueur – within the competitive environment. With this in mind, a tracking study was put in place to monitor specific changes in the product over a long period. In order to develop a measurement instrument that was as efficient as possible, various items were defined on the basis of a preliminary qualitative phase.
In a pretest, monadic groups of ca. 200 cases rated the client’s product as well as 4 competitor products on the basis of these items. The purpose of this pretest was to test the validity of the items with reference to the survey objective.
Answers were required to the following questions:
- Do the items allow key rating dimensions to be derived, permitting a compressed presentation of the results?
- Are all the items sufficiently clearly distinguishable, so that these dimensions can be unambiguously classified?
- Does the list contain redundancies, so that the length of the survey can be reduced by deleting some items?
- Do the items contain the required information (test validity of contents)?
Analysis
In order to answer the above questions, a factor analysis was carried out.
The following 16 items were examined:
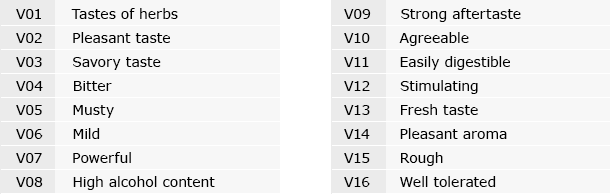
Ratings were on a 7-point scale, where 1 = “does not apply at all” and 7 = “applies completely”.
The factor analysis generated the following three fundamental dimensions:
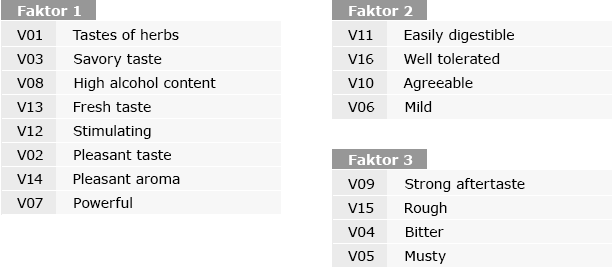
This solution makes sense from both a technical and content point of view.
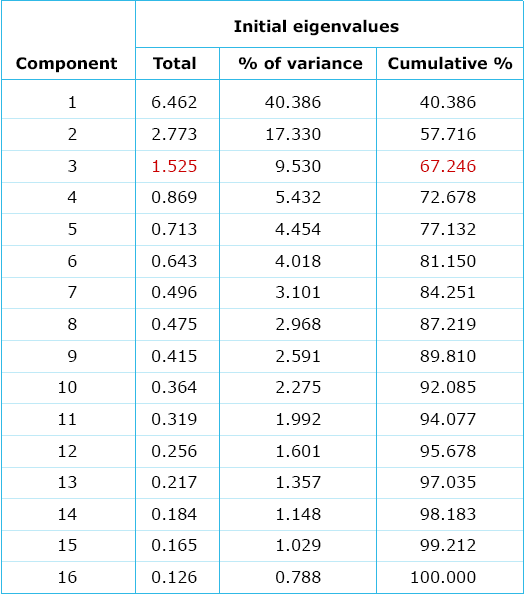
Fig. 1: Eigenvalues of the principal component analysis (tabular presentation)
A principal component analysis extracts, step-by-step, the latent features (principal components) that incorporate a maximum share of the remaining variance. In total, as many latent features can be found as there are observed features (in this case 16). All 16 principal components together make up the total variance of the 16 included items. In contrast to the observed features, which are all incorporated with a variance of 1, the share of variance covered by the principal components reduces from step to step.
Fig. 1 shows the eigenvalues of the principal components that correspond to the variance in this procedure. The reducing share of variance from the 1st to the 16th principal component is clearly apparent. The sum of all 16 eigenvalues, like the variance sum of all incorporated items, totals 16 (=100%).
The following criteria can be used to decide how many dimensions represent the fundamental features in a list of characteristics:
Kaiser criterion and explained variance
A principal component used should contain more information than an incorporated item, i.e. it should have an eigenvalue (variance) greater than 1.
Limits can be defined for the variance explained by the extracted factors. A figure of two-thirds has proved to be a practical benchmark.
Screetest
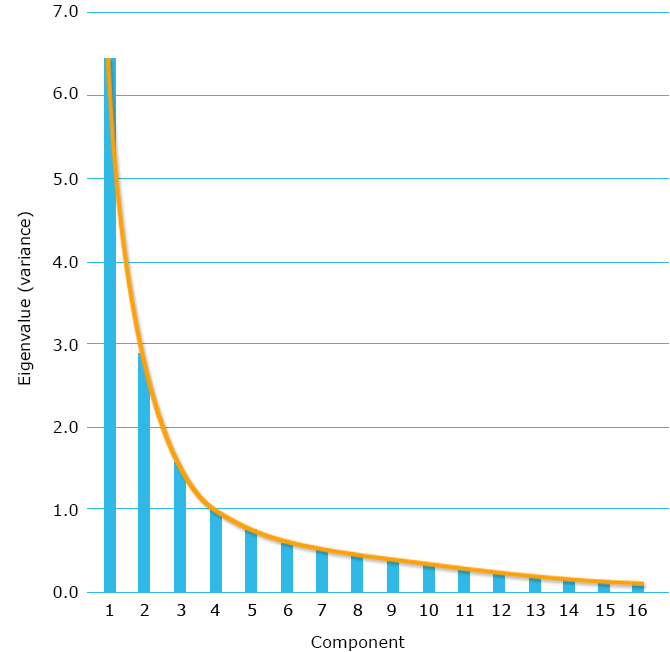
Fig. 2: Eigenvalues of the principal component analysis (graphical presentation)
A “kink” in the curve of the graph of eigenvalues (scree plot, see Figure 2) points to a suitable number of factors. If fewer dimensions are extracted, significant shares of variance are discarded. If more dimensions are used, these only contribute a comparatively insignificant share of variance.
Structure of loading matrix
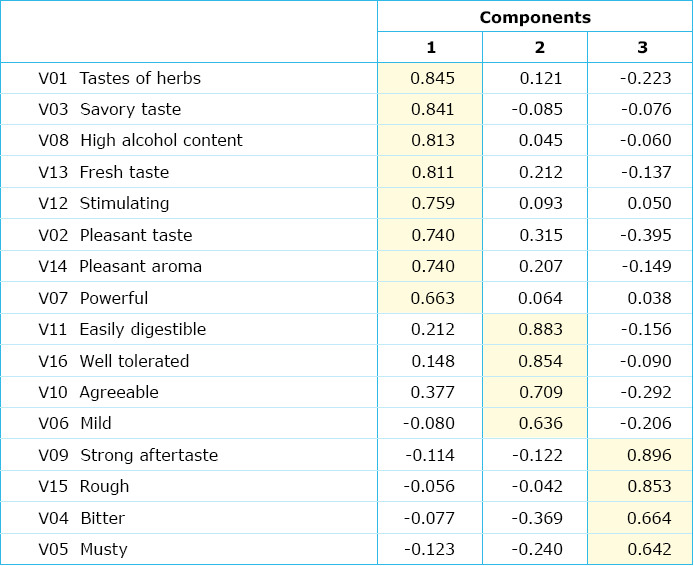
Fig. 3: Loading matrix
The loadings (correlations between items and factors, see Figure 3) should indicate unambiguous assignments, i.e. the absolute values in the main diagonals (marked in yellow) should be high, while the remaining values are low.
All these criteria point very clearly to three fundamental dimensions.
As well as these technical criteria, a consideration of their content also argues for this 3-factor solution:
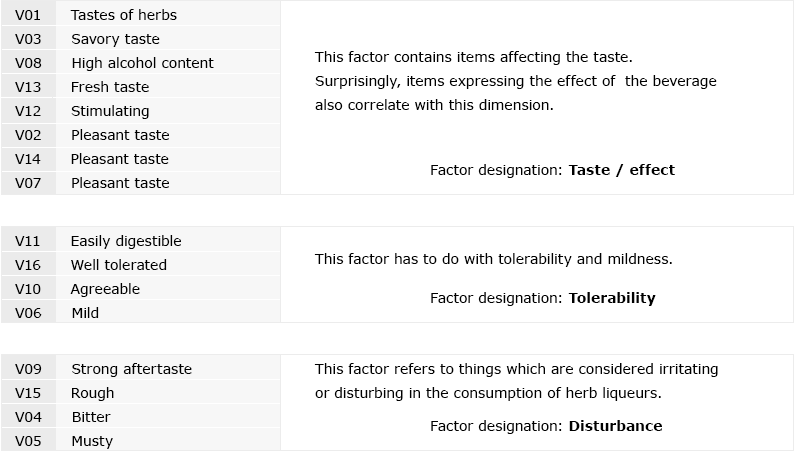
The fact that “bitter” is also included in Factor 3 shows that consumers tend to associate this with a perception of unpleasantness. A further aspect of the content validation is the surprising result that taste and effect items are perceived in a similar way (Factor 1). The fact that these also remain “linked” in higher-level factor solutions indicates that they are really to be treated as belonging to the same fundamental dimension.