CHAID Analysis

CHAID ANALYSIS FOR OPERATIONAL CUSTOMER BASE MANAGEMENT
One of the most well-known algorithms for constructing decision trees is CHAID (Chi-squared Automatic Interaction Detection). Such a decision tree illustrates the hierarchical partitioning of a dataset into increasingly homogeneous subgroups. CHAID helps to automatically create this tree by analyzing interaction effects between different variables and determining significant differences between groups. In this way, CHAID can assist in identifying data patterns and building predictive models.
EXAMPLE OF A CHAID ANALYSIS
You have master data about your customers and want to know which customers are most likely to respond to a mailing campaign? Or perhaps you have results from a CRM study showing acceptance levels for your brand and you want to know which customers are at the greatest danger of being lost to the competition and in which circumstances? These are typical situations for the application of CHAID analysis.
An easy-to-read tree diagram shows a hierarchy of those subgroups in which the responders or dissatisfied customers are most likely to be found. Thus, it is easy to ascertain whether or not there are attributes that can distinguish between the categories of the target variable. These attributes are arranged from the “trunk” to the “branches” according to their statistical significance.
The analysis indicates that women respond to the campaign significantly more strongly than men. The criterion for this is a predefined significance level, in this case 95%. There may be further features that have a significant impact on response behavior. At this level, however, the feature is applied that differentiates most strongly in terms of response rates.
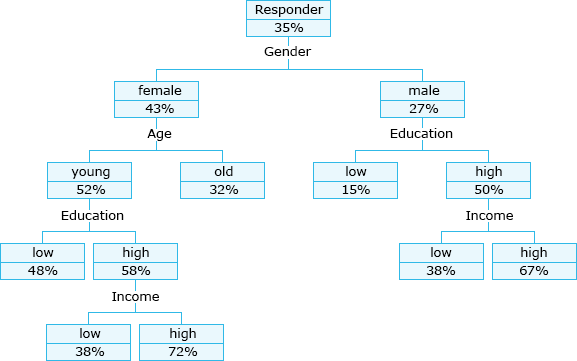
CHAID Analysis: Influence of categorial data on the response rate to a mailing campaign
There are clear differences between younger and older women. The campaign appeals to a share of 52% of younger women, a significant difference to the figure of 35% for the total sample. But even within this group there is a further heavily differentiating variable, namely education. High education levels lead to a significantly higher tendency to respond. And within this group again, higher income leads to higher agreement.
Thus, the group of young, educated women with higher incomes would be predestined for a mailing campaign of maximum efficiency. At 72%, they respond to the mailing more than twice as frequently as average. (It must refer to a campaign by a mail-order company selling shoes!)
In some circumstances, men also achieve a high response rate, i.e., those with higher levels of education and a high income. In this case, however, age appears to have no influence on response behavior.
CATEGORICAL VARIABLES NECESSARY FOR CHAID ANALYSIS
The variables must be present in categories (ordinal or nominal). Prior to the analysis, decisions must be reached about the degree of statistical significance to be applied and also about the number of cases at which groups should be separated or merged.
CHAID ANALYSIS DOES NOT PROVIDE LINEAR RELATIONSHIPS
The analysis does not provide linear relationships in the form “the more x, the more y” as is the case with regression analysis, for instance. Statements are made about individual categories and combinations of categories.